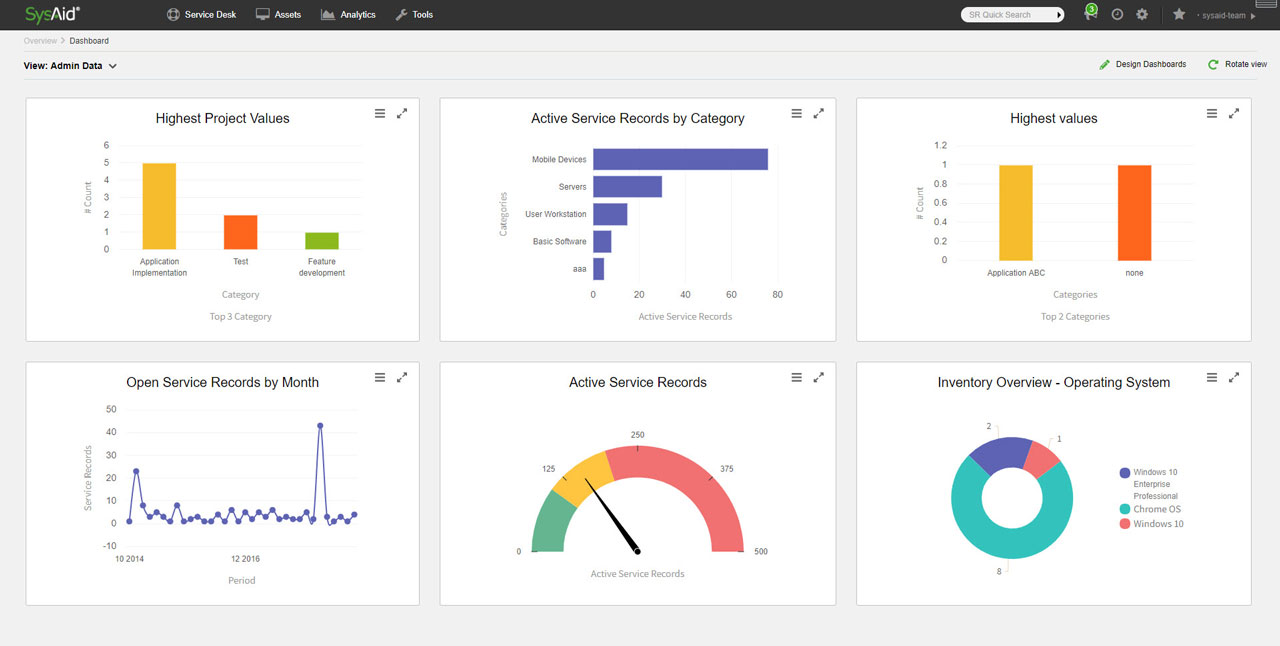
SysAid Manager Dashboard
Get real-time visibility into your help desk, IT service management, IT asset management, monitoring
activity, project performance, and portfolio of KPIs with your Manager Dashboard.
Better Understand Your Help Desk’s Workload
- View charts that show the number of active incident and service request records (open tickets) by month.
- Identify when your help desk is most and least busy.
- Consider options for smoothing out help desk call peaks and troughs.
Identify and Address Problems
- Create and view charts showing incident records grouped by incident category, service, asset type, group, and more – to identify potential problem areas.
- Quickly highlight problems and start to take the necessary actions to address them. For example, issues related to a particular business application might be due to the lack of appropriate end-user training rather than the application itself, so the investment in extra end-user training might be a far cheaper option than continuing to respond to the recurring incidents related to the application issue.
Monitor and Report on Service Quality
- Get greater insight and transparency into help desk performance.
- See how long it’s taking to respond to, and resolve, incidents and service requests.
- View your SLA performance and history in real-time.
- Monitor service breaches and define the warning, critical, and maximum breach values based on business requirements.
Track Inventory Status
- Get greater insight into the IT assets managed in SysAid IT Asset Management.
- Understand the status of your asset inventory in real-time.
- Monitor asset age profiles, manufacturers and models, your organization’s operating system profile, and more.
Identify Help Desk Trends
- Get real-time snapshots of your help desk’s performance, with the Manager Dashboard’s timelines of open tickets by day, week, and month – allowing you to follow performance over time, and identify trends, introduce improvements, and make forecasts about the future.
- Also identify trends, introduce improvements, and make forecasts for your company’s IT asset estate.
Built-in (Out-Of-The-Box) And Custom Reports
A wide variety of built-in and custom reports available via SysAid Manager Dashboard will help you to:
- Analyze your service desk workload and performance.
- Track your asset inventory.
- Check on the status of your tasks and projects.
You can filter any report to get the exact data you need and then share it in PDF or Excel format.
Report Wizard
Create your own reports with SysAid’s intuitive report wizard. In three quick steps, you can:
- Choose an entity to measure (e.g. incident record, service request record, problem record, change record, IT asset, activity, software product).
- Select the data to report on, either as a detailed report or as a summary report with a graph.
- Choose the available filters for when you run the report.
Report Scheduler
Set the SysAid Manager Dashboard to automatically run the reports you need, on a regular basis, using the report scheduler.
- Schedule reports to run on a daily, weekly, or monthly basis.
- Specify who will receive the reports and in which format.
- Run saved reports at any time, as needed.
Start Crushing IT