SysAid IT Benchmark
SysAid IT Benchmark allows you to evaluate your organization’s IT
performance against other SysAid customers and your own performance
history – for current and last month, and current and last year.
Sysaid IT Benchmark
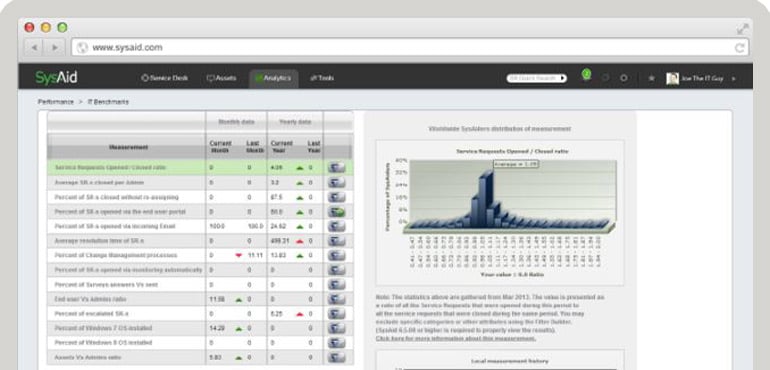
With SysAid IT Benchmark, you can instantly compare the performance of your IT department to the performance of IT departments around the world. Updated daily, view performance ratios for your company versus other SysAid customers, so you can set goals to help you beat the industry average for these ratios. SysAid IT Benchmark will not share any information that can be used to identify your company.
Use SysAid IT Benchmark to See the Bigger Picture
The IT benchmark capability provides you with a local history chart that displays activity trends over the past 60 days. These time-based measurements will help you to see the bigger picture and help to identify the root causes of issues that may be affecting, or will soon affect, your IT performance. For example, you may see that average resolution time has increased compared to previous periods, and then look to other performance trends to identify the cause. Perhaps an increase in first contact resolution, a jump in end-user numbers (new end-user groups might bring in new IT issues), or a shift in ticket type ratios to those that are more time intensive.
Example Benchmark Performance Measurements
- The ratio of opened/closed tickets
- The average number of tickets closed per service desk agent
- The percentage of tickets opened via incoming email
- Average resolution time for incidents, service requests, problems, and changes
- End user to service desk agent ratio
See How These Results Are Calculated
Start Crushing IT