Monitoring IoT disconnects


In our last two posts on Reducing Traffic by using AWS IoT (part 1 and part 2) we discussed how we used AWS IoT to reduce our polling traffic and how we can establish connections to AWS IoT through our clients’ firewalls. But, we left out an important part – monitoring. There are three things we can utilize to monitor the health of our system: CloudWatch metrics, IoT logs, and custom services.
Here we look at three things we can utilize to monitor IoT disconnects: CloudWatch metrics, IoT logs, and custom services. #IOT #tech Share on XMetrics
IoT publishes a number of metrics we can use. Looking at the Golden Metrics in Google’s SRE book we want to monitor errors and traffic at the very least. We can build a dashboard that shows us things like client connects and disconnects, errors and warnings, and message publications. All these metrics are readily available within CloudWatch and you can easily incorporate them into your dashboard.
Logs
Another essential part of IoT monitoring is logs. IoT logs report various events such as connect, subscribe, and publish together with metadata such as clientId and disconnectReason. These can be used to troubleshoot bugs in our environment. For example, if we see a client disconnecting and reconnecting frequently we can look into the logs. It can sometimes be the case that that we have two clients connecting with the same ID, which AWS doesn’t allow. Or we can look into the disconnectReason to try and find out more about why a client disconnected.
Logs are not turned on by default. To turn them on go to the AWS console and then to the IoT Core page. Now go to Settings > Manage Logs. Create an IAM role which has the appropriate permissions and select the log level you want. That’s it. Actually, no, not quite. There’s one more thing: if you used the console you enabled v1 logging, you really want v2 logging, which has more data, such as disconnectReason, and is in JSON, rather than text, format. You can enable logging (create the role, set the log level) through the console, but to enable v2 logging you must use the AWS CLI.
After enabling logging if you go to CloudWatch in the AWS console you’ll see a new log stream called AWSIotLogsV2. That stream is most easily viewed in Log Insights. The query language for Log Insights is simple, check it out here. By issuing a query like:
fields @timestamp, clientId, eventType, @message| sort @timestamp desc| filter eventType = 'Disconnect'| limit 20
You’ll be able to see recent disconnects and which client disconnected.
Custom services – alerting when a client goes offline
All of that is good for getting an overview of your IoT usage and troubleshooting, but what if we wanted to be notified when clients went offline? There are at least three ways to do this. First, we could use a MQTT feature called Last Will and Testament. When our client connects it can send a message to the broker to save, with the topic that the broker should send it to. When the client disconnects the broker will send that message. If we listen to the appropriate topic we can easily be notified of that message.
Second, we can set a CloudWatch alarm to alert us on disconnects. Both the Last Will and Testament and CloudWatch alarms are very simple to set up, but they do come with one disadvantage: what if the disconnect was very brief? Remember that IoT periodically renews the connection if there was no communication for longer than the keepalive interval. The renewal consists of a disconnect followed by an immediate reconnect. We probably want to ignore events like these.
And this brings us to the third method, which is more complicated but allows us to ignore short disconnects. We’ll have to create a custom service. In order to build our alerting microservice we have to use two features of IoT we haven’t talked about yet: IoT Rules and reserved topics.
IoT rules are actions that allow for integration between IoT topics and AWS services. Reserved topics are where IoT events are published to. For example, when a Thing is created a message is published to the topic $aws/events/thing/thingName/created. When a client subscribes to a topic a message is published to $aws/events/subscriptions/subscribed/clientId and when a client disconnects a message is published to $aws/events/presence/disconnected/clientId. It’s important to note that AWS makes no guarantee as to the order of message arrival and we’ll have to take that into account.
Now that we know about the building blocks of our service, let’s start planning. Here are the basic components of our microservice:
- Three IoT rules listening on the connect and disconnect topics.
- A SQS delayed message queue.
- A lambda which handles messages from the queue.
- A DynamoDB table. Its keys are clientIds and the values are a list of timestamps of connect and disconnect events. For example: myClient -> [‘20211001T101010’, ‘20211001T101011’]. The table’s TTL is equal to the maximum time we allow the client to be disconnected before we alert.
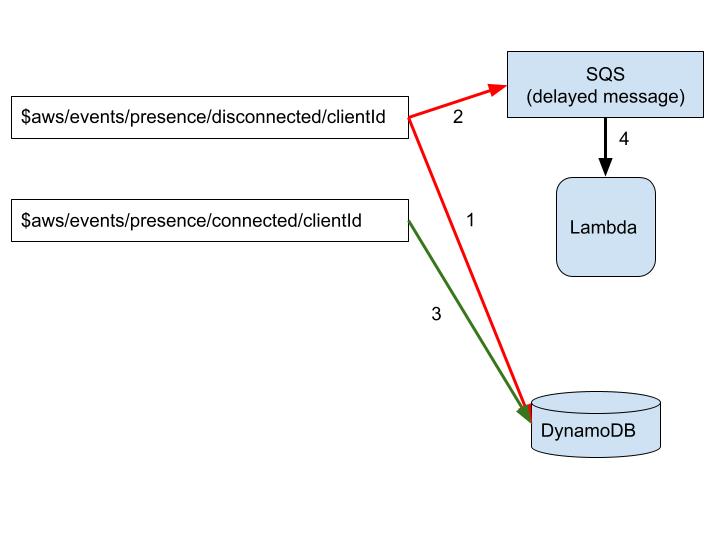
The flow is: when a client disconnects from IoT an IoT rule (1) is activated. The rule listens to the disconnect topic. Whenever a client disconnects, it will get the message from the disconnect topic, extract the clientId and write an entry in a DynamoDB table with the clientId as key and a list with the event timestamp as value.
Another rule (2), on the same topic, will write a message with the clientId to a SQS delayed message queue. We set the delay for the maximum time we allow the client to be disconnected before we alert.
The third rule (3) listens to the connect topic and adds the connect time to the clientId entry in the DynamoDB table. Now, when the delayed message reaches the lambda (4), the lambda checks the DynamoDB table. If the number of entries in the list is even (that is, the number of connect and disconnect events is equal) we’re fine, but if it’s odd then there’s a disconnect with no matching connect and we should do something about it.
That’s all there is to it. The terraform and java code for this whole service is here. Check it out.
Does all this sound interesting? Great! I’m hiring a software architect. If you want to talk here’s a link to the job description: https://www.sysaid.com/company/careers/positions/co/rd/F4.22A/software-architect/all
Did you find this interesting?Share it with others:
Did you find this interesting? Share it with others:
Meet Dex: the autonomous IT engineer that eliminates tickets before they appear
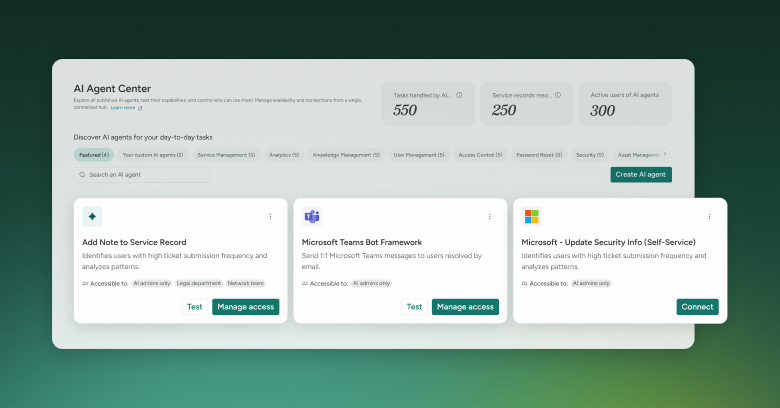
SysAid’s AI Agent Center: Command and control for your AI Agents
How SysAid manages agents behind restricted firewall rules with AWS IoT Core

Microservices Architecture: Asynchronous Communication is Better